Eastern Indonesia Bouguer gravity lineaments
Overview
This study of gravity lineaments in the Banda Arcs area of eastern Indonesia and north Australia shows faults and other geological features resulting from density contrasts within and between combined Bouguer anomaly surfaces computed using different reduction densities.
The images on this page have been created by producing a number of complete Bouguer anomaly surfaces at different reduction densities. The reduction densities range from 0.10gm/cc (close to the free-air anomaly), through the standard crust reduction density of 2.67gm/cc and then down to 3.4gm/cc. Each surface was then examined for linear features, each feature being colour-coded for the reduction density used. Each set of linear features was then combined to produce the multi-coloured images on this page.
The colour scheme starts with red for shallow depth features, then passes through yellow to green and finally into increasingly darker blues for features at the greatest depth. Depth, in this instance, is a relative term.
In combination these coloured strings portray the likely locations of subduction zones/traces, faults, thrusts, sea-floor volcanoes, horsts and grabens and many other geological features that give rise to a density contrast. Additionally, the combination of strings, resulting from low to high reduction densities (0.10 to 3.4gm/cc), creates a semi-planar surface that gives an indication of how the focii of density contrasts varies with depth, for example, some faults show the direction of dip.
The images have been tuned to show more clearly features in marine areas; the on-shore resolution is low. More detailed tuning is possible but this results in images, at this scale, that are too saturated in detail for display on web pages.
Scroll below the Interactive maps section to see the gravity lineaments at deep, mid and shallow-levels.
Details of the data used are available on the Data Sources page.
Details of the reduction process are available on the Data Processing page.
Please read the caveats at the bottom of this page.
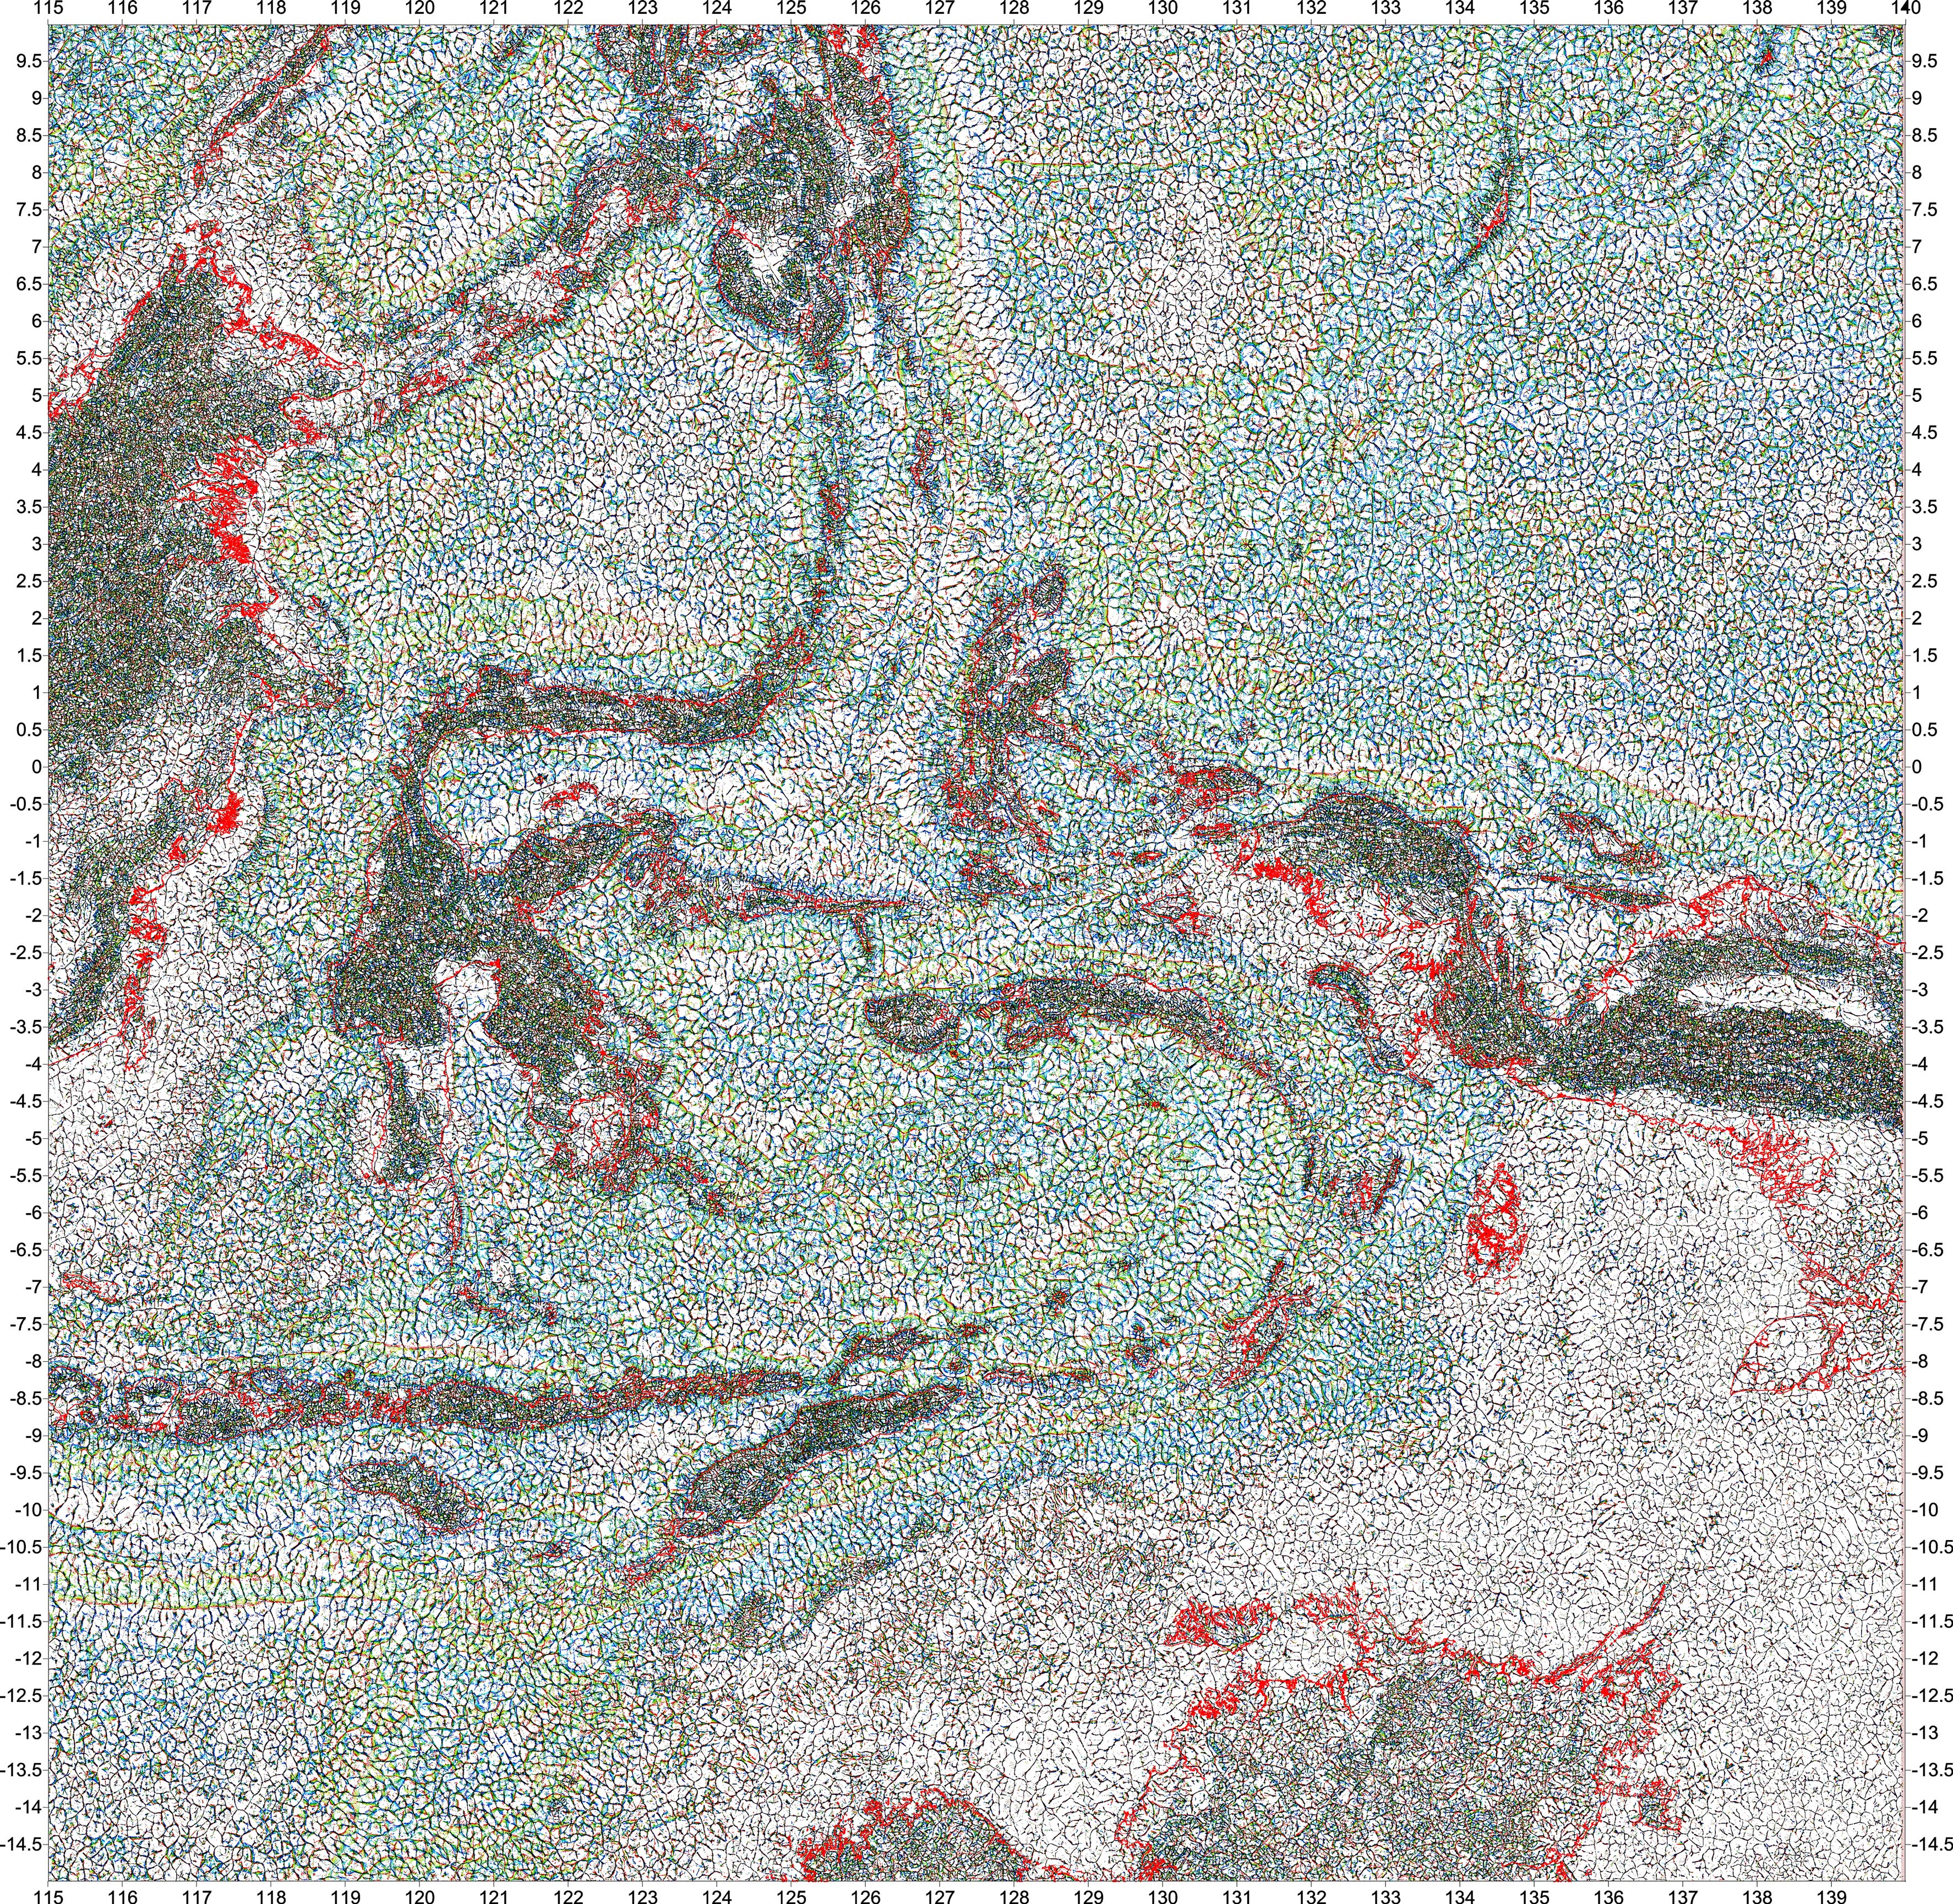
Interactive maps - Eastern Indonesia lineaments of complete Bouguer gravity anomalies
The map below has been sectioned into 25 clickable regions. Clicking on a particular region will open a new tab showing the zoomed in region in more detail. To see the whole image in a new tab click here (7.5mb jpeg) .

Combined lineaments of the complete Bouguer anomaly
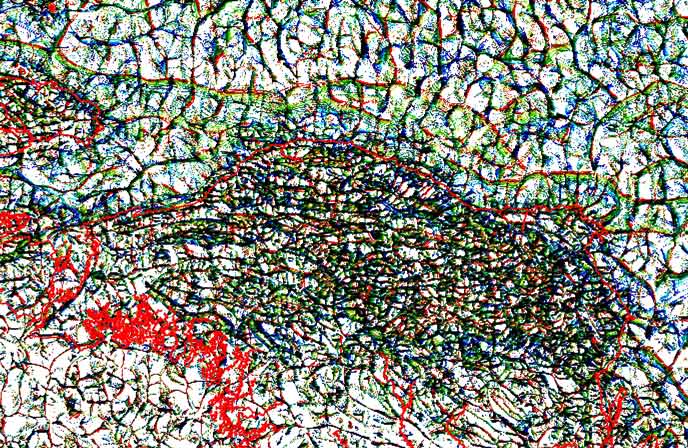
The image below, of the Bird's Head, is comprised of the same lineaments as that above but they have been allowed to cumulatively combine. One result is black lines where multiple Bouguer lineaments overlie each other. The level of blackness is indicative of the total depth of the geological boundary and/or how vertical the boundary is. Elsewhere, the black lines overlie deeper coloured lines (typically greens and blues) suggesting discontinuity between shallow and deeper tectonic regimes. Click on the image to open a larger image for the whole Eastern Indonesian region (6 mb).
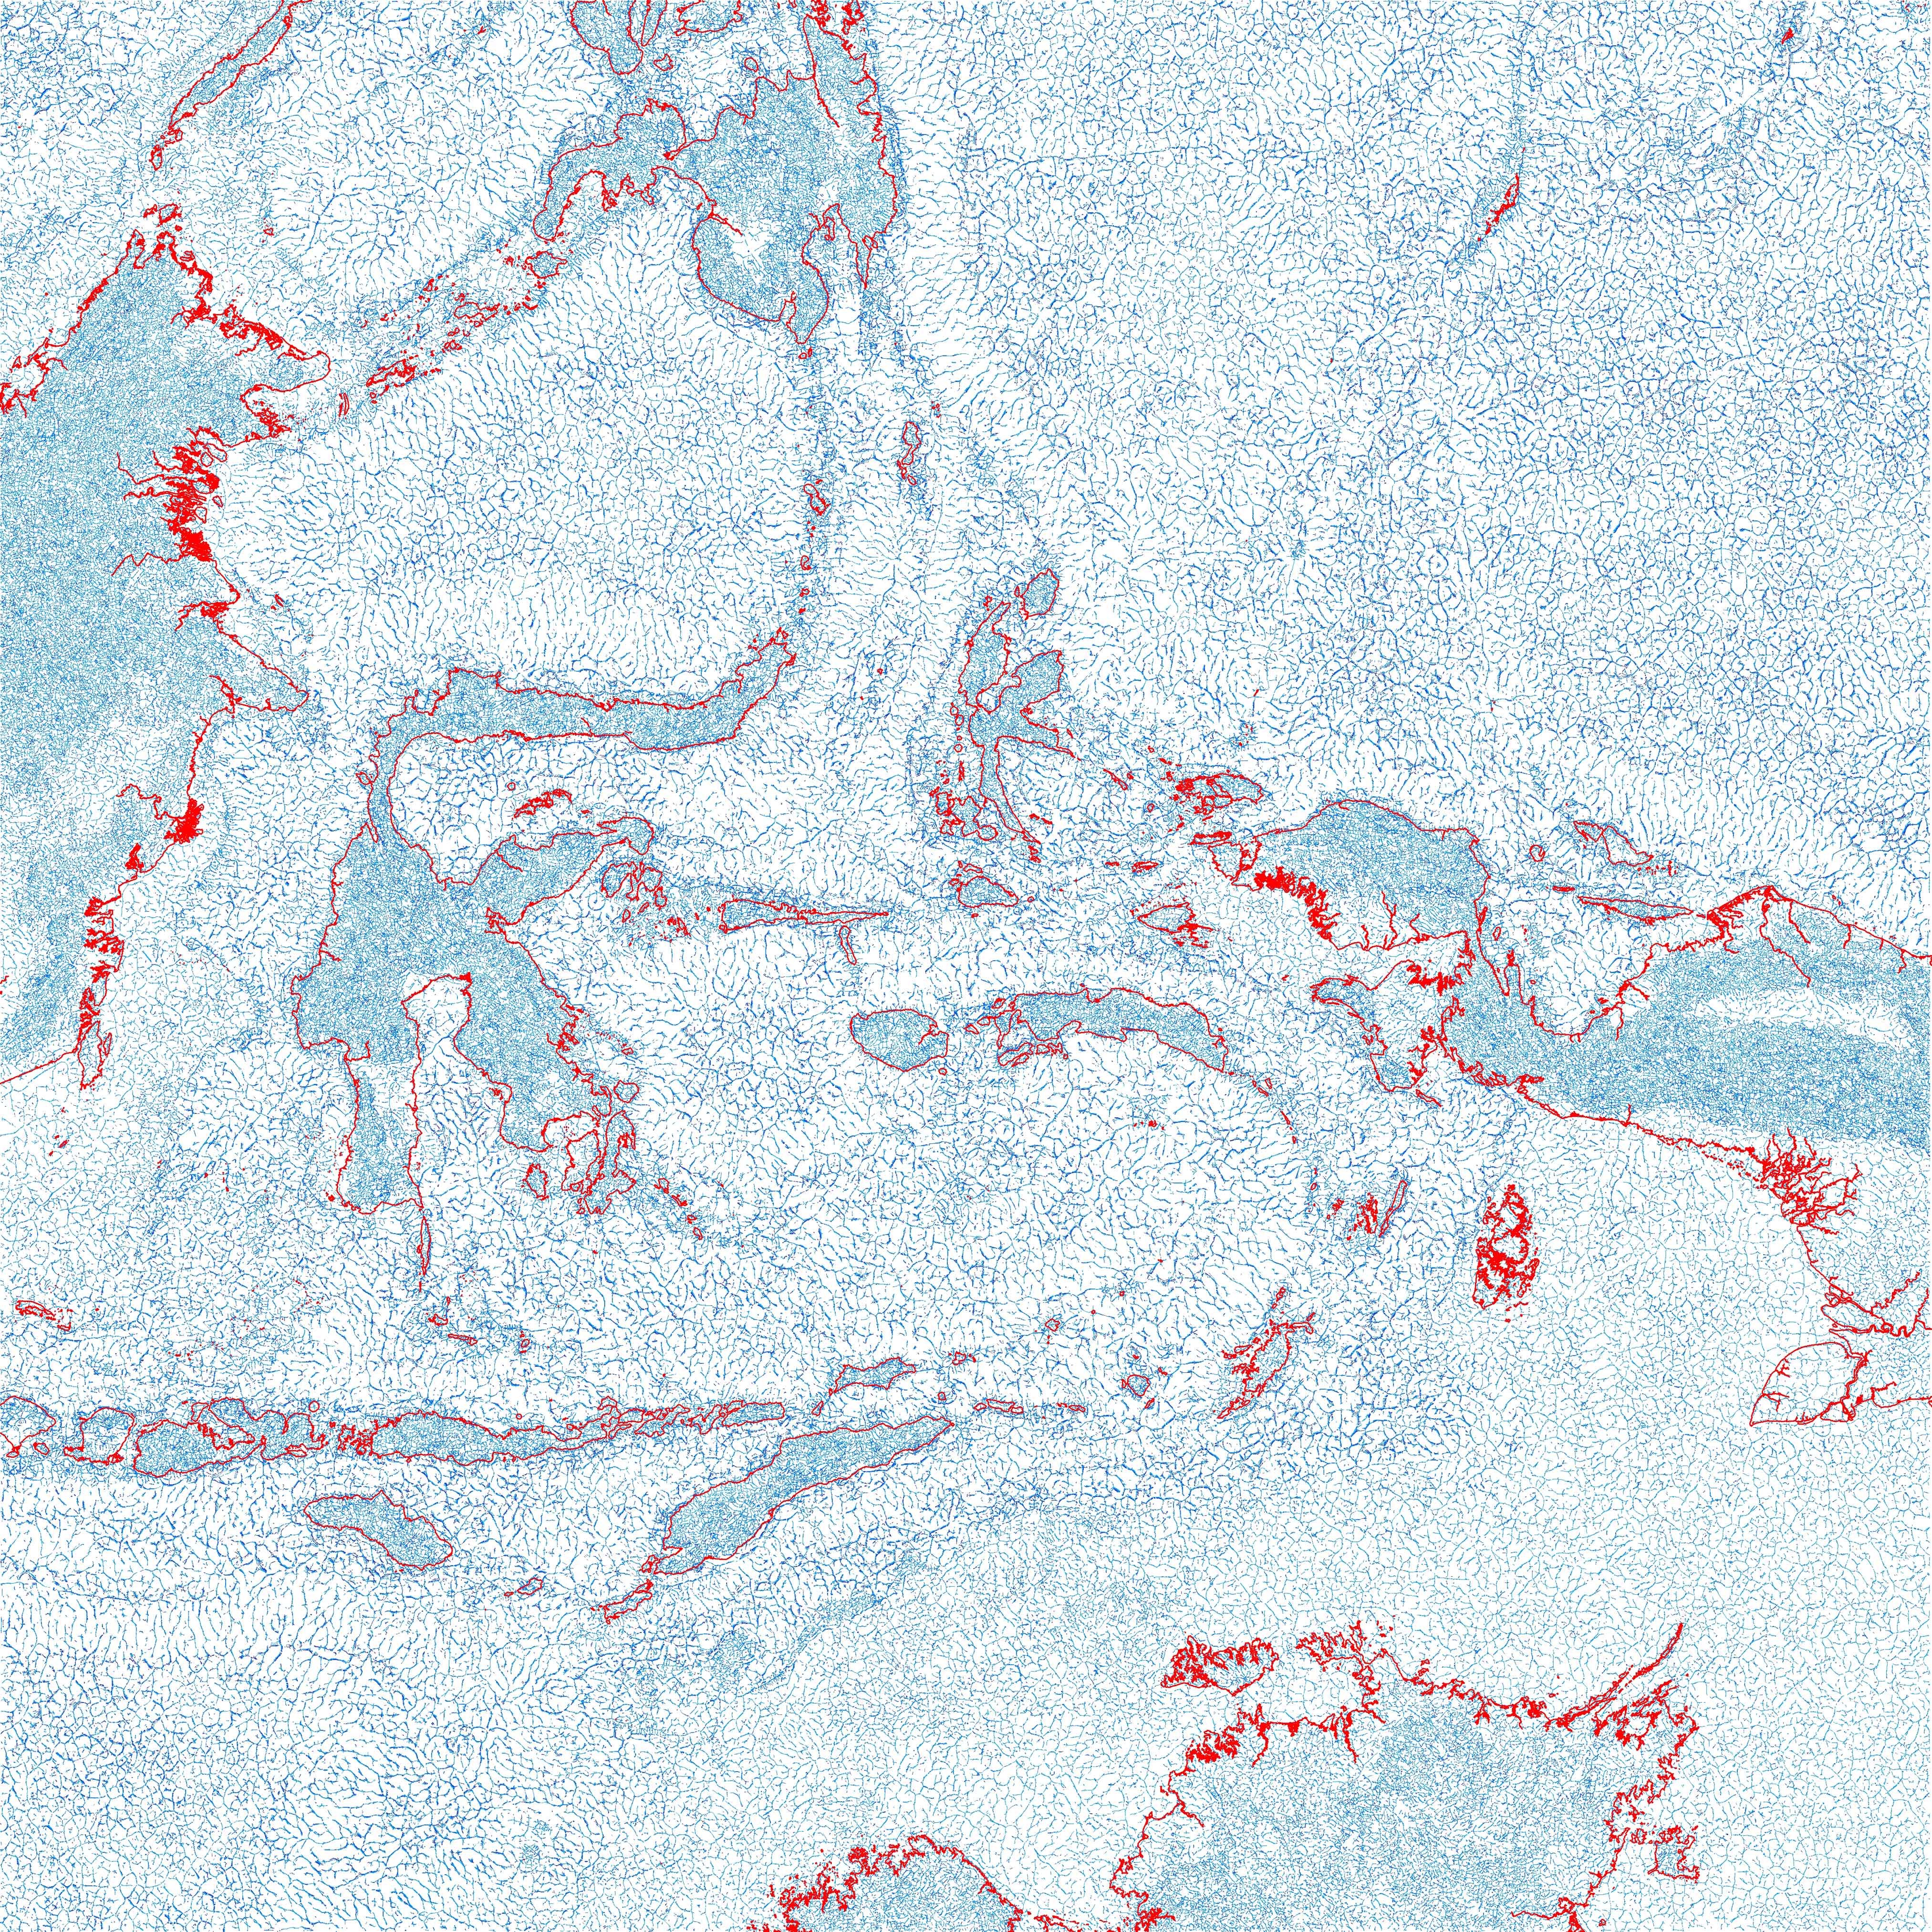
Deep-level Gravity Lineaments
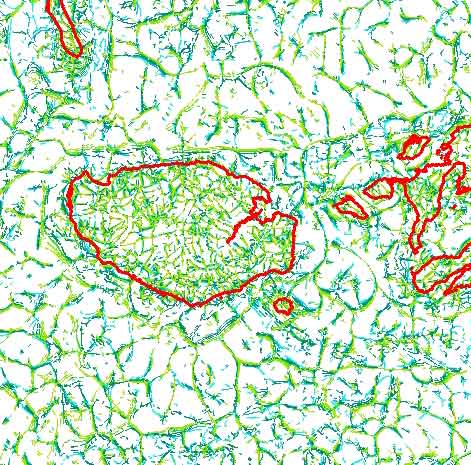
The image below is of the area around eastern Timor and Wetar and shows only the deeper level lineaments in blue. The following two images are for the medium and shallow levels. Amongst other benefits, examining each may help identify shallow faults from deeper seated faults. Click on the image to open a larger image for the whole Banda Arcs region (3.5meg).

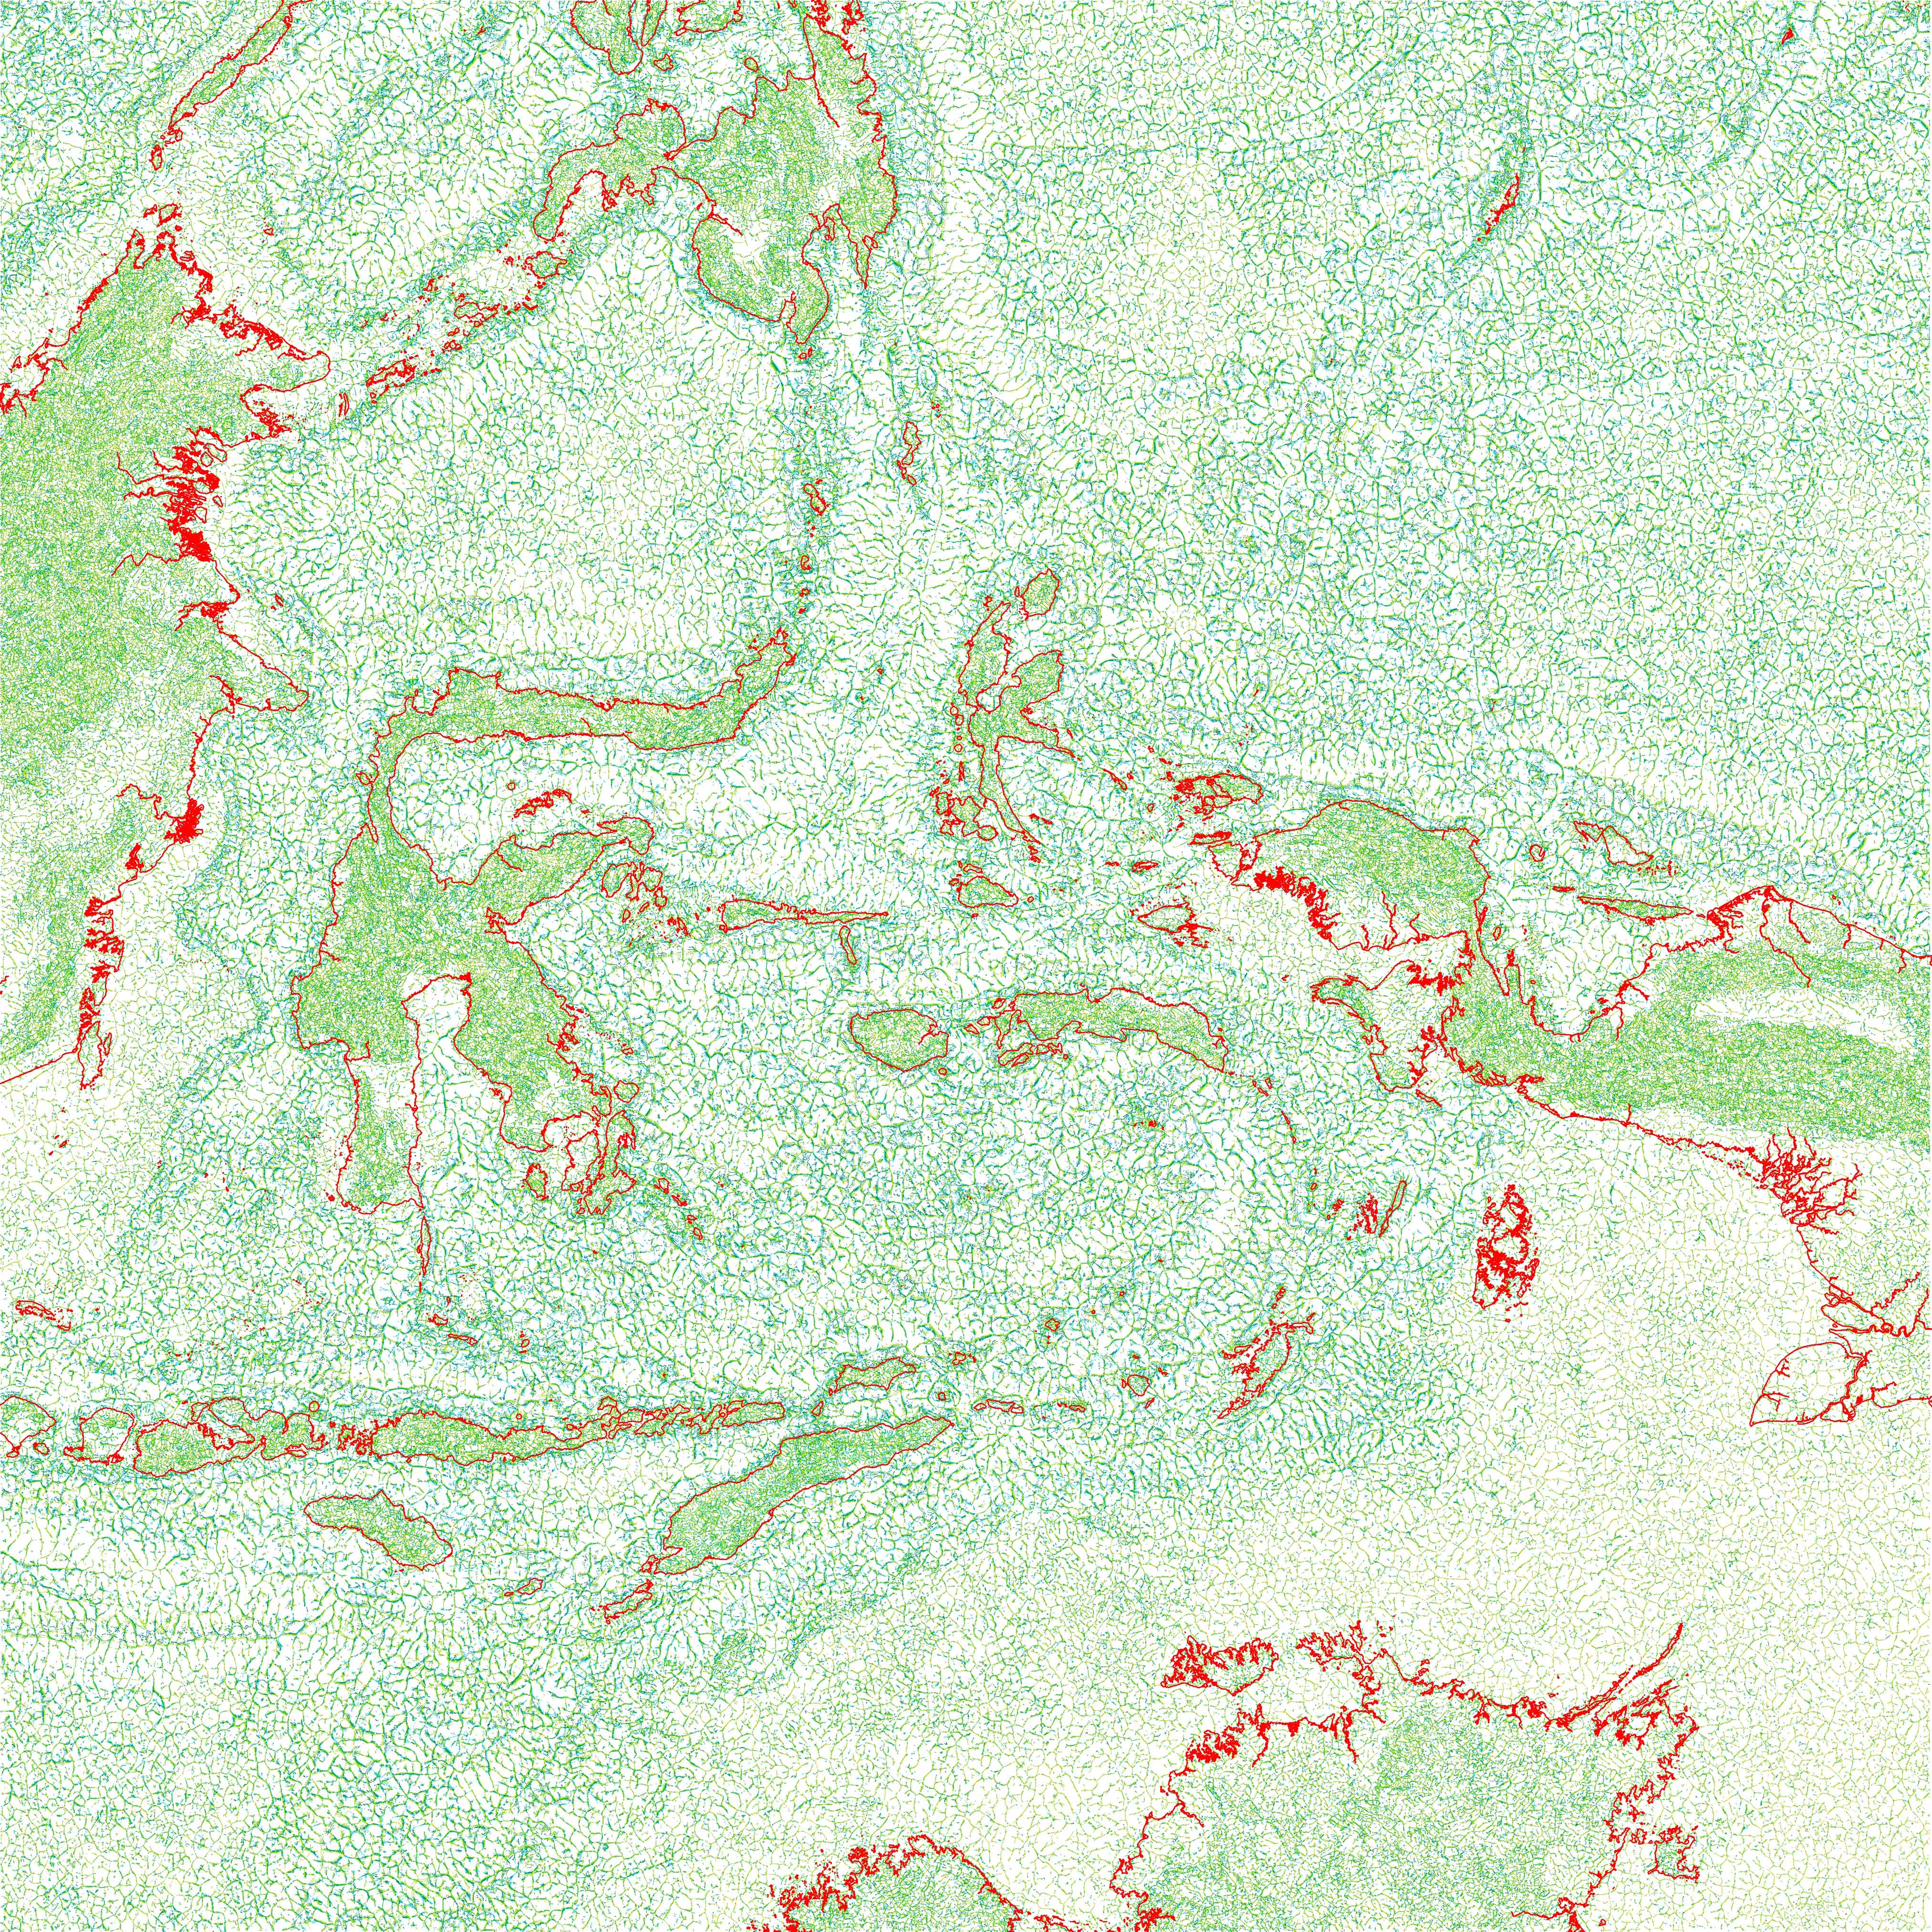
Mid-level Gravity Lineaments
The image below is of the area around Buru and shows only the mid-level lineaments in yellows and greens. Click on the image to open a larger image for the Eastern Indonesia region (3.21meg).
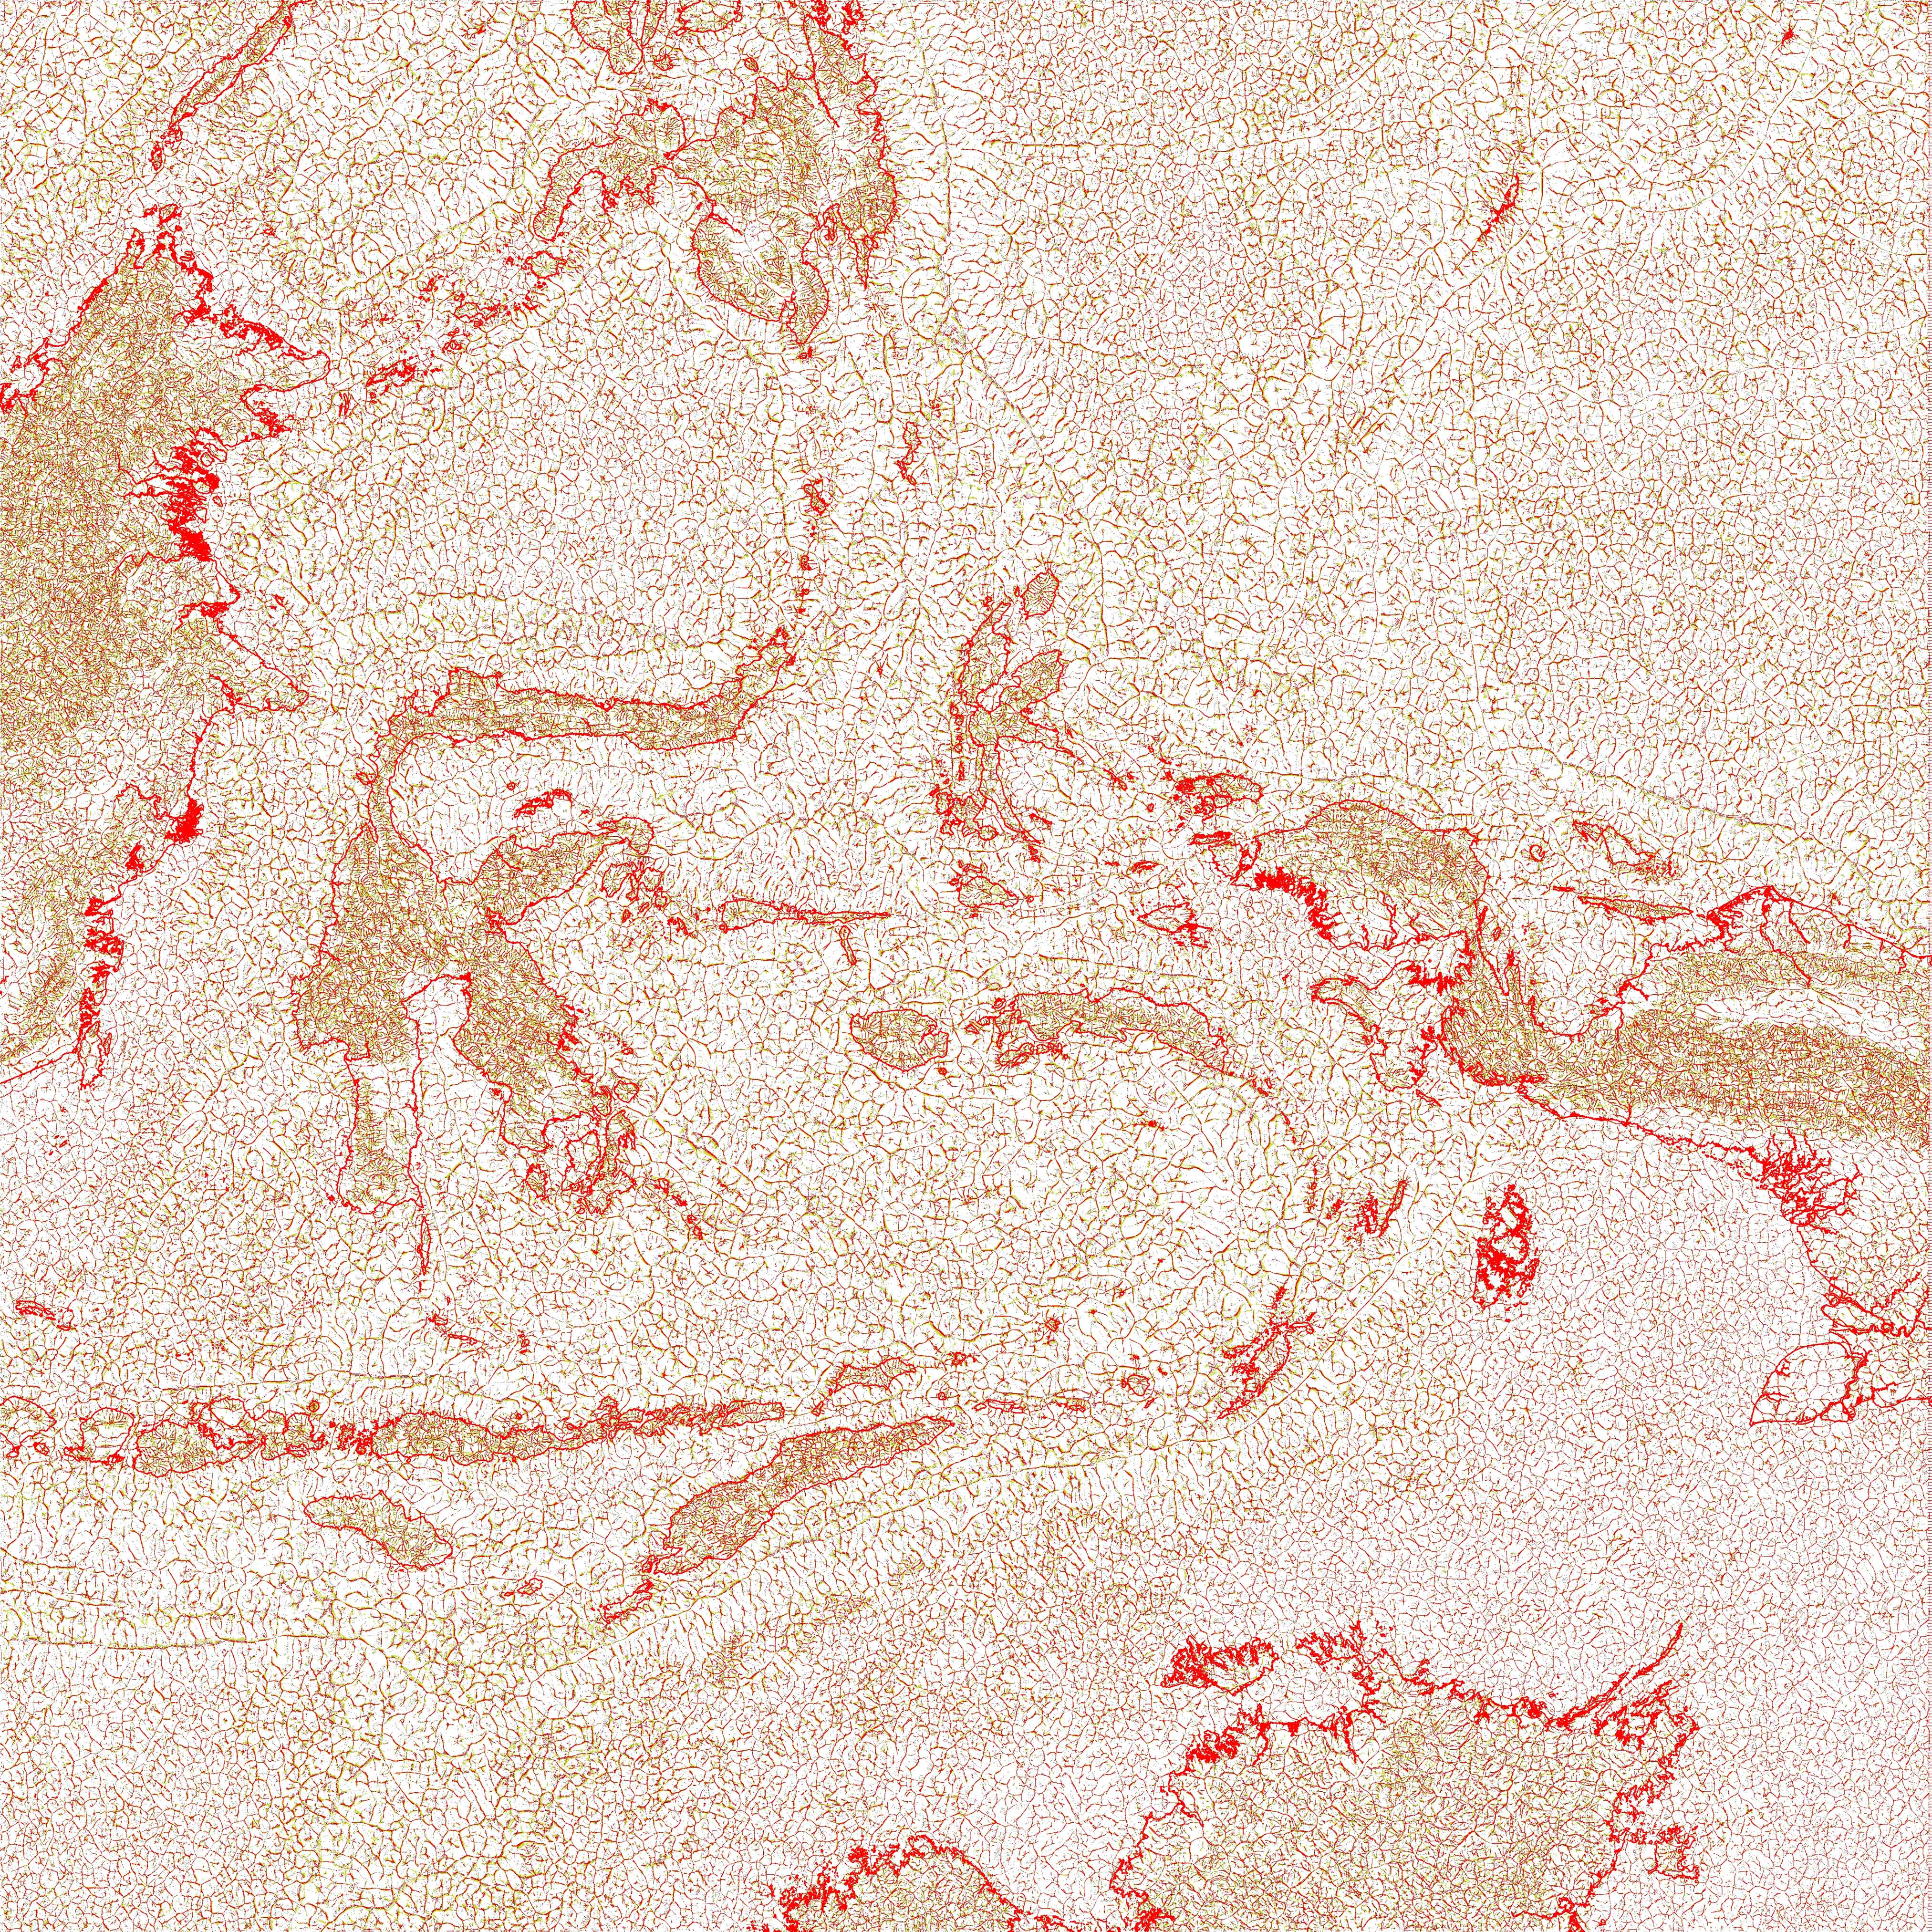
Shallow-level Gravity Lineaments
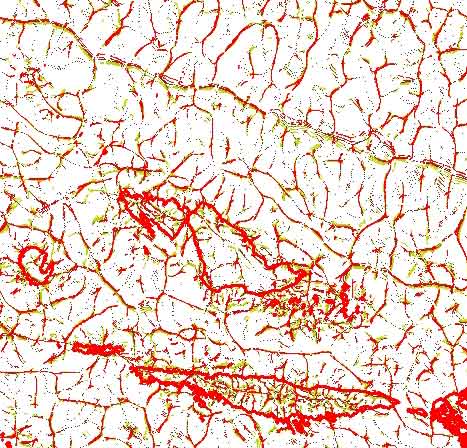
The image below is of the area around Yappen and shows only the shallow level lineaments in reds and yellows. This image is closest to the classical free-air anomaly and shows major lineaments relating to significant topographic features, e.g. Timor, Seram and Tanimbar Troughs. Click on the image to open a larger image for the whole Eastern Indonesia region (4 meg).
Caveats:
-
The usual warnings of non-uniqueness of the gravity method apply.
-
The lineaments have been produced from grids of 0.004166 arc degrees but the original gravity and topography grids had a resolution of 0.01667 arc degrees (1 minute of arc). Images on this site are degraded from the originals.
-
Some geophysicists think it inappropriate to replace sea-water with rock, i.e. applying a Bouguer correction to marine areas. They may also think that to then combine multiple Bouguer surfaces is even worse. This author takes a pragmatic view - if the results are beneficial and allow a greater understanding of this under-resolved region, so much the better.
-
The method has been tuned to primarily show large, long-wavelength features from the marine areas; the land areas are not as well resolved.
-
Satellite derived gravity measurements are unreliable in water depths shallower than 200-300 metres and for bathymetric features with a wavelength shorter than approximately 15Kms. These limitations essentially produce an unknown and immeasurable level of noise on top of longer wavelength bathymetric features. These factors affect much of the Arafura Sea and the area between Australia and Indonesia.
-
Bathymetric shiptrack data have not been removed from the satellite topography grids used to produce the complete Bouguer correction. Consequently some lineament features will be caused by these data.
-
Edge effects have not been removed, hence the red, thick border to many images.
© Steve Kaye. Protected under UK and international law. May be used free of charge. Selling without prior written consent prohibited. Obtain permission before redistributing. In all cases this notice must remain intact.